This page contains affiliate links. If you purchase through them we may earn a small commission at no extra cost to you. Learn more
Installed Capacity vs Actual Output: Why Your 4kW System Won't Produce 4kW
What does kWp actually mean?
When you see a solar system described as "4kW" or "4kWp", that number refers to its kilowatt peak rating — the maximum power output measured under Standard Test Conditions (STC) in a laboratory.
STC specifies three things simultaneously:
- Irradiance: 1,000 W/m² of sunlight hitting the panel surface
- Cell temperature: exactly 25°C
- Air Mass: 1.5 (a standardised measure of how much atmosphere the sunlight passes through)
Here's the thing: these three conditions essentially never occur at the same time in the UK. The irradiance figure is generous for our latitude, 25°C cell temperature is unrealistically cool for a panel sitting on a roof in sunshine, and AM 1.5 is an approximation. kWp is a standardised benchmark for comparing panels against each other — it was never meant to be a promise of real-world output.
Seven reasons actual output is lower
1. Irradiance levels
STC assumes a constant 1,000 W/m² of sunlight. The UK receives roughly 800-1,050 kWh/m² per year of total solar irradiation, varying by location (Cornwall gets more than Aberdeen). Even on a clear June day in southern England, peak irradiance typically reaches 900-950 W/m² — close to STC, but not quite there, and only for a brief period around solar noon.
For most of the day and most of the year, irradiance is well below 1,000 W/m². On an overcast day, it might be 100-300 W/m².
2. Temperature losses
This one surprises people. Solar panels lose efficiency as they heat up. A panel rated at 25°C cell temperature will be significantly warmer on a roof in summer — roof-mounted panels routinely reach 50-60°C on hot sunny days.
Modern TOPCon panels have a temperature coefficient of around -0.30%/°C. With cells at 50°C (25 degrees above STC baseline), that's a 7.5% loss. At 60°C, it's 10.5%. The irony: the sunniest, hottest days produce the highest irradiance but also the worst temperature losses, partially cancelling each other out.
3. Roof orientation
A south-facing roof at 30-35° tilt is optimal, capturing 100% of potential output. But most UK roofs aren't perfectly south-facing:
- Southeast or southwest: ~95% of south-facing output
- East or west: ~80% of south-facing output
- North-facing: ~55% of south-facing output
If your panels face east-west across two roof planes, you'll get roughly 80-85% of total potential — spread across a longer day, which actually helps with self-consumption.
4. Shading
Even minor shading has an outsized effect. A chimney shadow crossing one panel, a tree branch, or a TV aerial can significantly reduce output. With traditional string inverters, one shaded panel drags down the performance of every other panel on the same string — like a slow car in a single-lane road.
Optimisers or microinverters solve this by letting each panel operate independently, but they add cost.
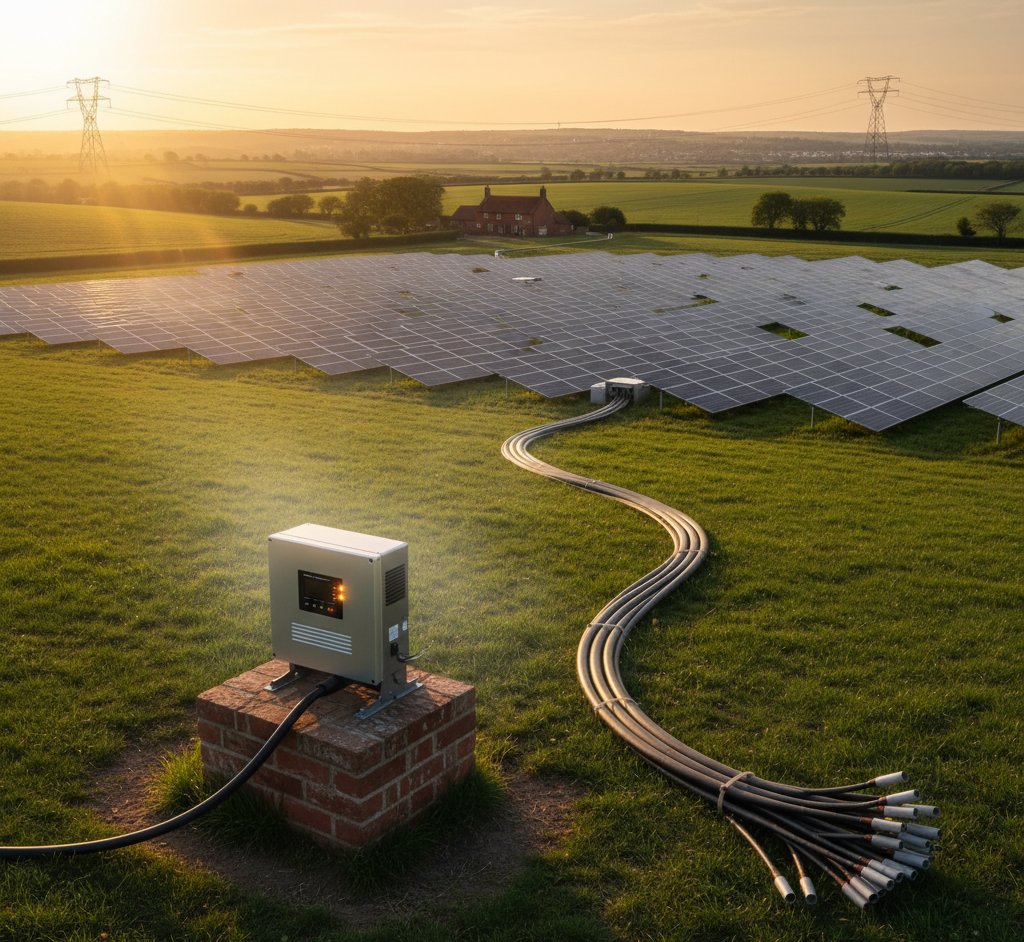
5. Inverter efficiency
Your inverter converts DC electricity from the panels into AC for your home. Even good inverters lose 2-4% in this conversion, operating at 96-98% efficiency. This is a small but unavoidable loss.
6. Wiring and connection losses
Electricity travelling through cables from panels to inverter to consumer unit loses a small amount to resistance. Typically 1-2%, more if cable runs are unusually long.
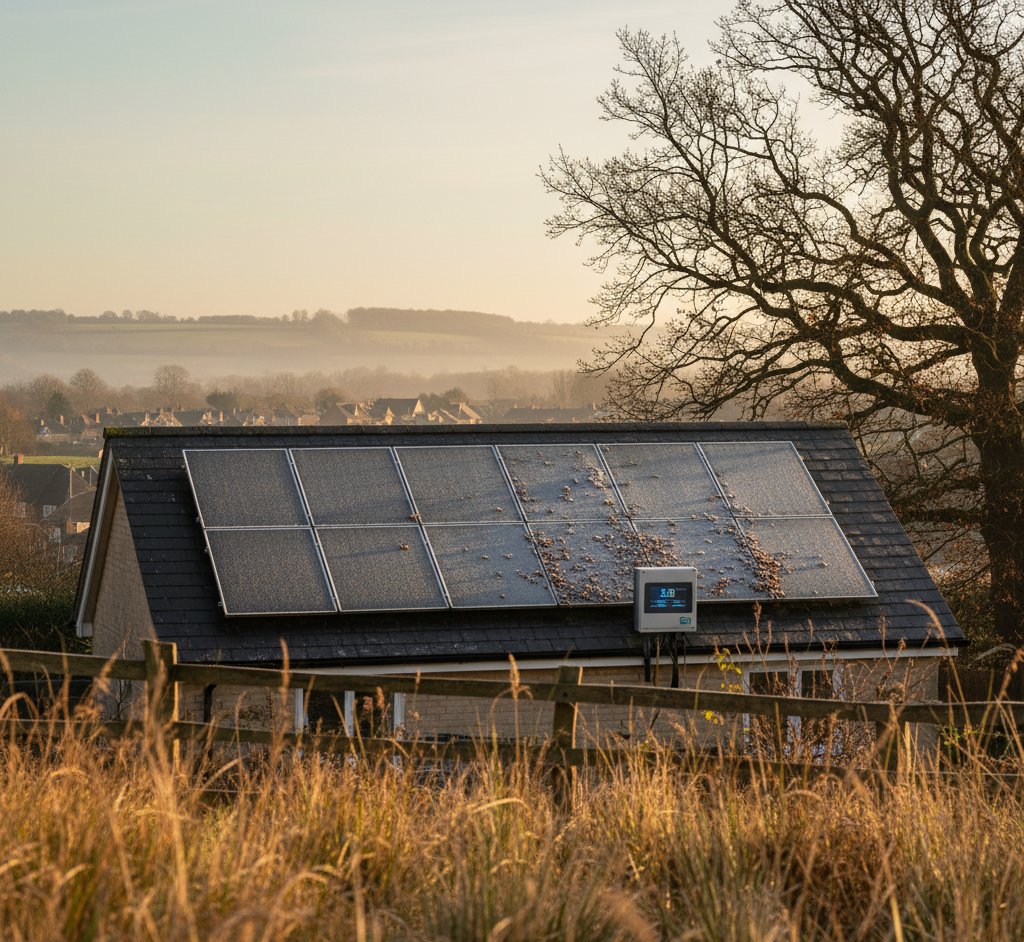
7. Soiling
Dirt, bird droppings, pollen, and lichen accumulate on panel surfaces. In the UK, rain does a reasonable job of keeping panels clean, but expect 1-3% losses from soiling. Panels near trees or under regular bird flight paths fare worse.
Real-world numbers for a 4kW system
Let's put this together for a 4kW system, south-facing, in London, with no shading.
The theoretical maximum (absurd but illustrative): 4kW running at full power for every hour of the year = 4 x 8,760 = 35,040 kWh. Obviously impossible — the sun doesn't shine at night, and full rated power never happens continuously.
The MCS expected figure: 4 x 1,020 kWh/kWp (London's regional factor) = 4,080 kWh/year. This already accounts for typical real-world losses and is the figure your installer should quote.
What you'll see on your monitoring app at different times:
| Conditions | Typical output |
|---|---|
| Best hour of the best summer day | 3.2-3.6 kW |
| Typical sunny afternoon | 2.5-3.2 kW |
| Bright but overcast | 0.5-1.5 kW |
| Heavy cloud or rain | 0.1-0.5 kW |
That peak of 3.2-3.6 kW from a 4kW system is not a fault. It's physics.
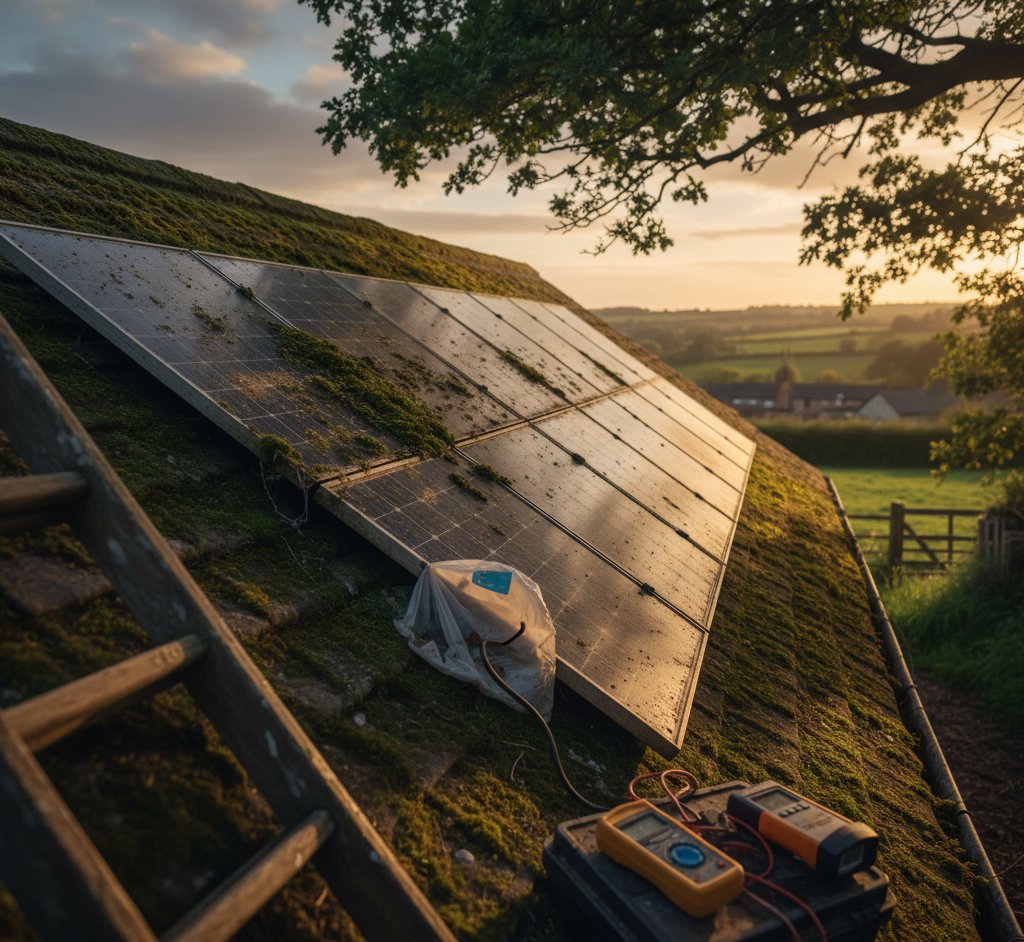
Check your monitoring against MCS figures, not kWp
If you want to know whether your system is performing well, compare your annual generation against the MCS expected yield for your region and system size — not against the kWp rating. If you're hitting 90-110% of the MCS figure, your system is working as it should.
The capacity factor: why 10-12% is normal
The capacity factor measures what percentage of a system's theoretical 24/7 maximum it actually produces over a year. For UK solar, this figure is approximately 10-12%.
That sounds alarmingly low until you think about it. The sun doesn't shine at night (roughly half the year's hours gone immediately). UK weather is cloudy much of the time. Winter days are short. The capacity factor for solar in the UK reflects these realities — it doesn't mean your system is underperforming.
For comparison, onshore wind in the UK has a capacity factor of about 26%, and even gas power stations average around 40% (they're not running at full blast all the time either).
Why none of this should worry you
If the gap between rated capacity and actual output sounds like a problem, it isn't — for one simple reason: everyone involved already knows this.
Your installer uses MCS-derived generation tables that account for your location, orientation, tilt, and shading. When they tell you a 4kW system will generate around 3,800-4,200 kWh per year in southern England, that figure already includes all the losses described above.
Payback calculations use realistic generation figures. The economics of solar work at real-world output, not at the STC fantasy of 35,040 kWh from a 4kW system. When your payback estimate says 7-9 years, it's based on actual expected production.
The kWp rating exists so you can compare one panel against another under standardised conditions — the same way a car's official fuel economy lets you compare models, even though you'll never achieve those exact figures on real roads. It's a benchmark, not a guarantee.
Your 4kW system won't produce 4kW. It was never supposed to. But it will produce roughly 3,800-4,200 kWh per year in a good location, and the financial case was always built on that reality.
Share this article
OVO has carefully selected trusted teams across the UK to install solar panels and heat pumps. Enjoy the personal touch of a local expert with the peace of mind of a household name.
Affiliate link — we may earn a small commission at no extra cost to you
Stay informed
Get free solar updates direct to your inbox
Related reading
Why Your Inverter Limit Matters More Than Your Panel Capacity
Your panels might be rated at 5kW but your inverter only outputs 3.6kW. Here's why that's normal, when it's a problem, and what 'clipping' actually costs you.

Month-by-Month Solar Generation in the UK: What to Actually Expect
Realistic monthly generation figures for UK solar panels by region. Based on MCS data, not optimistic marketing claims.
My Solar Panels Are Underperforming: A Diagnostic Checklist
Your solar isn't generating what you expected? Work through this systematic checklist before calling your installer. Most 'underperformance' has a simple explanation.

Switch to Octopus Energy
Get 50 credit when you switch. We get 50 too — win-win.
What does this mean for YOUR home?
Design your perfect solar setup in under 3 minutes. Free, no sign-up required.
Build Your Solar System