This page contains affiliate links. If you purchase through them we may earn a small commission at no extra cost to you. Learn more
My Solar Panels Are Underperforming: A Diagnostic Checklist
You check your app, look at the numbers, and something feels wrong. Your solar panels aren't generating what you thought they would. Before you pick up the phone to your installer, work through this checklist. In our experience, most "underperformance" has a straightforward explanation — and often isn't underperformance at all.
Step 1: Check the Season
This is the most common explanation. If you installed solar in summer and you're now looking at winter figures, the drop can feel alarming — but it's completely normal.
UK solar generation is heavily weighted toward the longer days of spring and summer. A system that generates 4,000 kWh per year doesn't generate 333 kWh every month. The distribution looks roughly like this:
| Month | % of Annual Generation | Example (4,000 kWh/yr) |
|---|---|---|
| January | 3% | 120 kWh |
| February | 5% | 200 kWh |
| March | 8% | 320 kWh |
| April | 10% | 400 kWh |
| May | 12% | 480 kWh |
| June | 13% | 520 kWh |
| July | 13% | 520 kWh |
| August | 11% | 440 kWh |
| September | 9% | 360 kWh |
| October | 7% | 280 kWh |
| November | 5% | 200 kWh |
| December | 4% | 160 kWh |
Between November and January, you'll generate roughly 12% of your entire annual total. That's it. On a short, overcast December day, a 4 kW system might produce 2–4 kWh. That's not a fault — that's the UK in winter.
What to check: Find your MCS certificate (your installer should have provided this). It includes an expected annual generation figure based on your system size, location, roof orientation, and tilt. Compare your actual annual total against that number, not against individual months.
Give It a Full Year
You can't meaningfully assess solar performance until you've had a full 12 months of data. If your system was installed in June and it's now November, you haven't seen enough to judge. Wait until you've completed a full calendar year before drawing conclusions about overall performance.
Step 2: Check Your Monitoring
The second most common cause of "underperformance" is monitoring problems. Your panels may be generating perfectly well — you just can't see it.
WiFi connection: Most inverters connect to the manufacturer's cloud platform via your home WiFi. If the inverter loses its WiFi connection (router restart, WiFi password change, signal too weak in the garage), it stops uploading data. The panels keep generating — you just don't see the figures in your app. Check whether the inverter's WiFi indicator light is on. If it's been offline, there'll be a gap in your data that looks like zero generation.
CT clamp position: If your system uses a CT clamp (a ring that clips around a cable in your consumer unit to measure power flow), it must be fitted in the correct orientation. Fitted backwards, it will show export as import and vice versa, or give nonsensical readings. If your figures look wrong from day one, ask your installer to check the CT clamp.
Cloud portal vs app: GivEnergy, SunSynk, Solis, Fox ESS, and most other inverter brands have both a phone app and a web-based cloud portal. If your app is showing odd data, log into the cloud portal directly — it sometimes gives a more reliable view. The portal URL is usually printed in your inverter manual.
Check the Generation Meter
Your generation meter (the small meter usually mounted near the inverter) records total lifetime generation regardless of WiFi. If the generation meter total has been climbing but your app shows gaps, the problem is monitoring, not generation. See our guide to reading your generation meter.
Step 3: Check for Shading
Shading is the silent killer of solar performance. Even a small shadow on one panel can have a disproportionate effect on your whole system.
New obstructions: Has anything changed since your panels were installed? Common culprits include:
- Trees that have grown taller or filled out
- A neighbour's extension or loft conversion
- A new satellite dish, aerial, or flue
- Scaffolding on a nearby building (temporary but frustrating)
How shading affects output: In a standard string inverter system, panels are wired together in series. If one panel in a string is shaded, it drags down the output of every panel in that string. A shadow covering just one panel can reduce the output of your entire array by 30-50%. This is a fundamental limitation of string inverter systems.
If you have power optimisers or microinverters, shading on one panel only affects that individual panel. The rest of your array continues to perform normally.
Time-of-day check: Shading changes throughout the day as the sun moves across the sky. Go outside and observe your panels at different times:
- Morning (8-10am): shading from the east — trees, neighbouring buildings
- Midday (11am-1pm): overhead obstructions — aerials, chimneys, dormers
- Afternoon (2-5pm): shading from the west — similar causes, opposite side
A panel that is clear at noon but shaded from 3pm onwards is losing a significant chunk of afternoon generation.
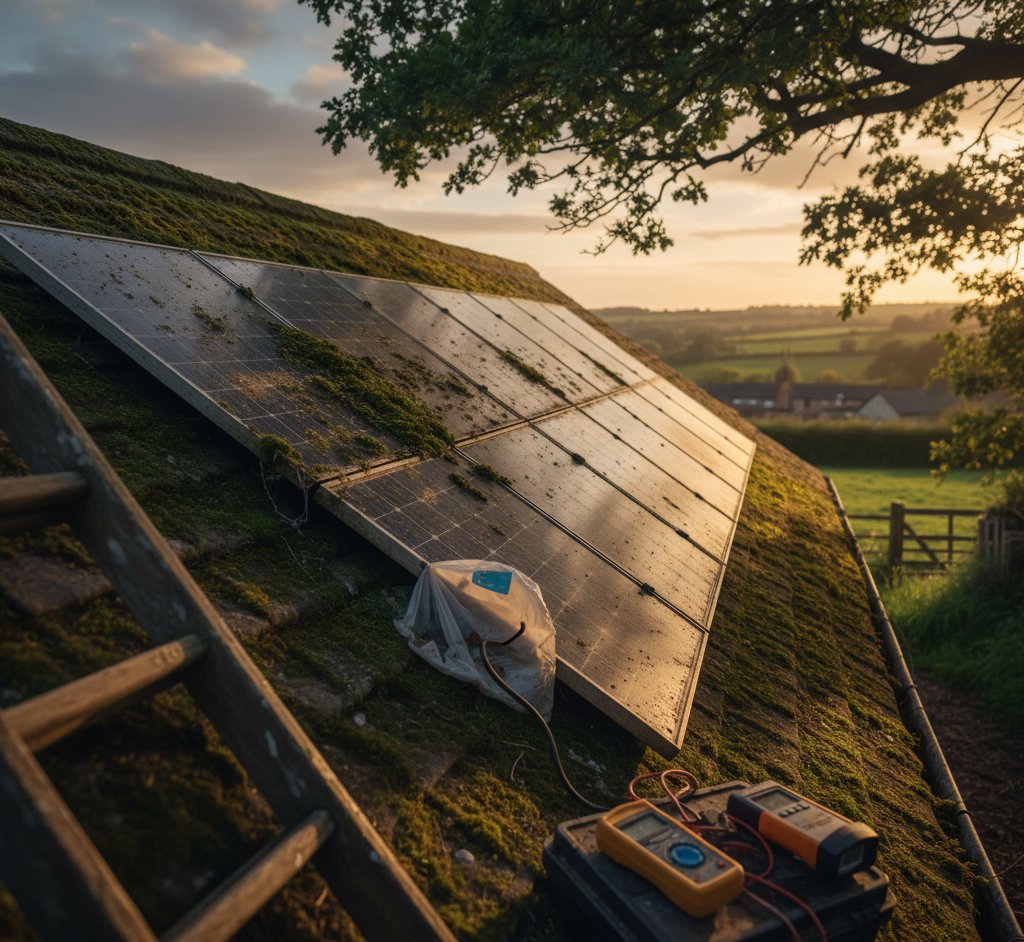
Step 4: Check the Panels
Most panel issues are visible from the ground with binoculars.
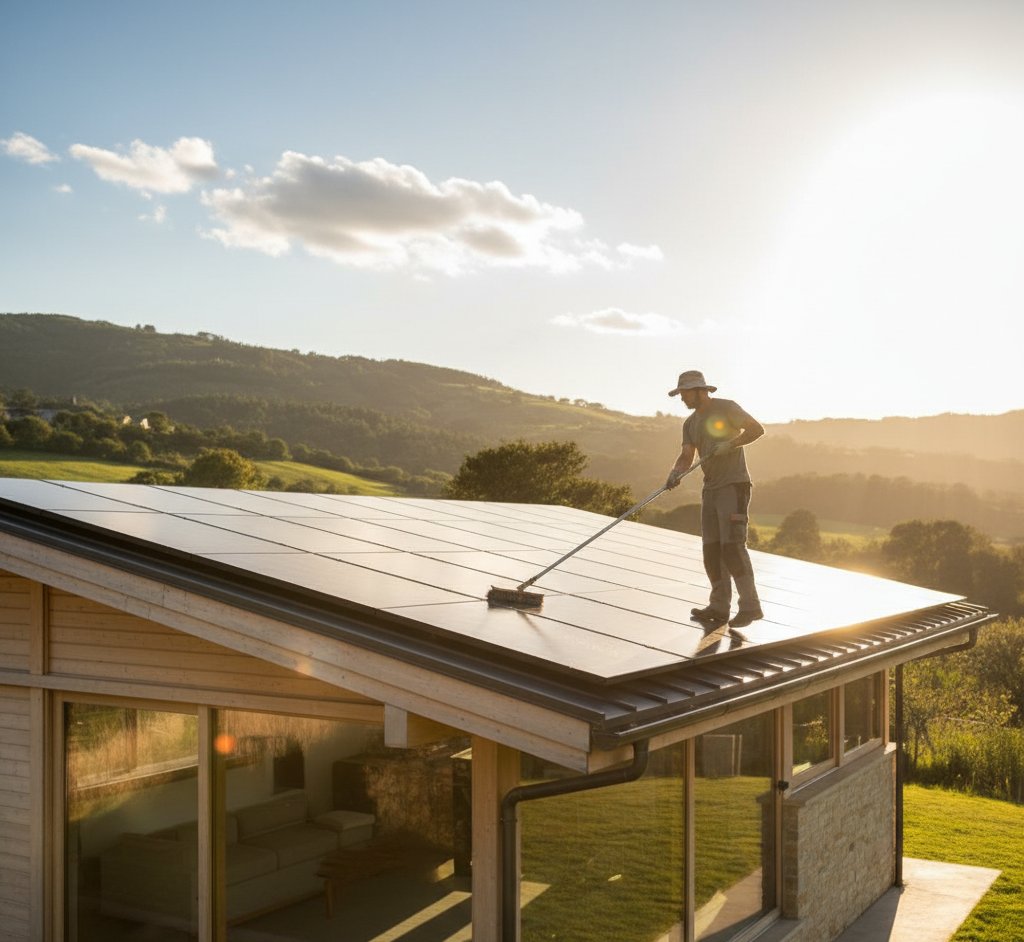
Soiling: UK rain keeps panels reasonably clean, but it doesn't remove everything. Bird droppings, especially under aerials or perching spots, can bake on and block individual cells. Pollen and tree sap build up under overhanging branches. Moss can grow in persistently shaded corners, particularly on panels with lower tilt angles. See our guide to cleaning solar panels for practical advice.
Physical damage: Look for cracked glass (often from impact damage — a stray football, falling branch, or hailstone). Check for browning or yellowing of cells, sometimes called "snail trails" — dark lines that spread across the cell surface. This indicates moisture ingress and cell degradation. Early-stage snail trails may not affect output significantly, but they worsen over time.
Delamination: The layers of a solar panel can separate, allowing moisture between the glass and the cells. This shows as bubbling, whitening, or cloudy patches on the panel surface. Delamination is a manufacturing defect and should be covered under warranty.
Bird nesting: If you don't have bird proofing, pigeons and other birds may be nesting under your panels. Nesting material can block ventilation (panels need airflow underneath to stay cool), and heavy accumulations of droppings on the roof surface can eventually cause problems. Check from ground level — if you see birds regularly going under the panels, they've probably moved in.
Step 5: Check the Inverter
Your inverter converts the DC electricity from your panels into AC electricity for your home. It's the component most likely to develop issues.
Error codes: Check the inverter display or app for fault codes. Common ones include:
- Earth fault / isolation fault: Can be caused by water ingress into a panel junction box, damaged cable insulation, or a failing DC isolator. This is a safety protection — the inverter shuts down to prevent danger.
- Grid frequency / voltage error: The grid is outside acceptable parameters. This is usually a grid issue, not your system. If it happens occasionally and resolves itself, it's normal. If it's persistent, contact your DNO.
- Arc fault: A loose connection somewhere in the DC wiring. This requires professional investigation.
Overheating: Inverters generate heat during operation, and most have a cooling fan. If the fan runs constantly or the inverter feels excessively hot, check that it has adequate ventilation. Inverters installed in enclosed cupboards, behind closed doors, or in direct sunlight can overheat and reduce output (thermal throttling) or shut down entirely.
Inverter clipping: If your panel capacity exceeds your inverter's rated output — which is common and intentional in many UK installations — the inverter will cap generation at its maximum. For example, 5 kW of panels on a 3.6 kW inverter (the G98 limit) means that on the brightest summer days, you lose some peak generation. This is by design. The oversized array generates more in mornings, evenings, and cloudy conditions, which more than compensates for the small amount of clipping at midday peaks.
Do Not Open the Inverter
Inverters contain potentially lethal voltages. Never remove the cover or attempt to repair an inverter yourself. If your inverter is showing persistent error codes, contact your installer or a qualified solar electrician. Even when the AC supply is switched off, DC voltage from the panels is still present whenever there is daylight.
Step 6: Check Generation Against Your Expectations
Sometimes the system is working perfectly and the problem is the expectation.
Installer estimates: Some installers overestimate generation by 10-20% to make the financial case look better. If your installer quoted you 4,500 kWh/year but your MCS certificate says 3,800 kWh/year, the MCS figure is the more reliable benchmark. MCS calculations are standardised and based on real irradiance data for your location.
Calculating expected output: You can estimate what your system should generate using this formula:
System kW x Annual Irradiance (kWh/kWp) x Orientation Factor = Expected Annual kWh
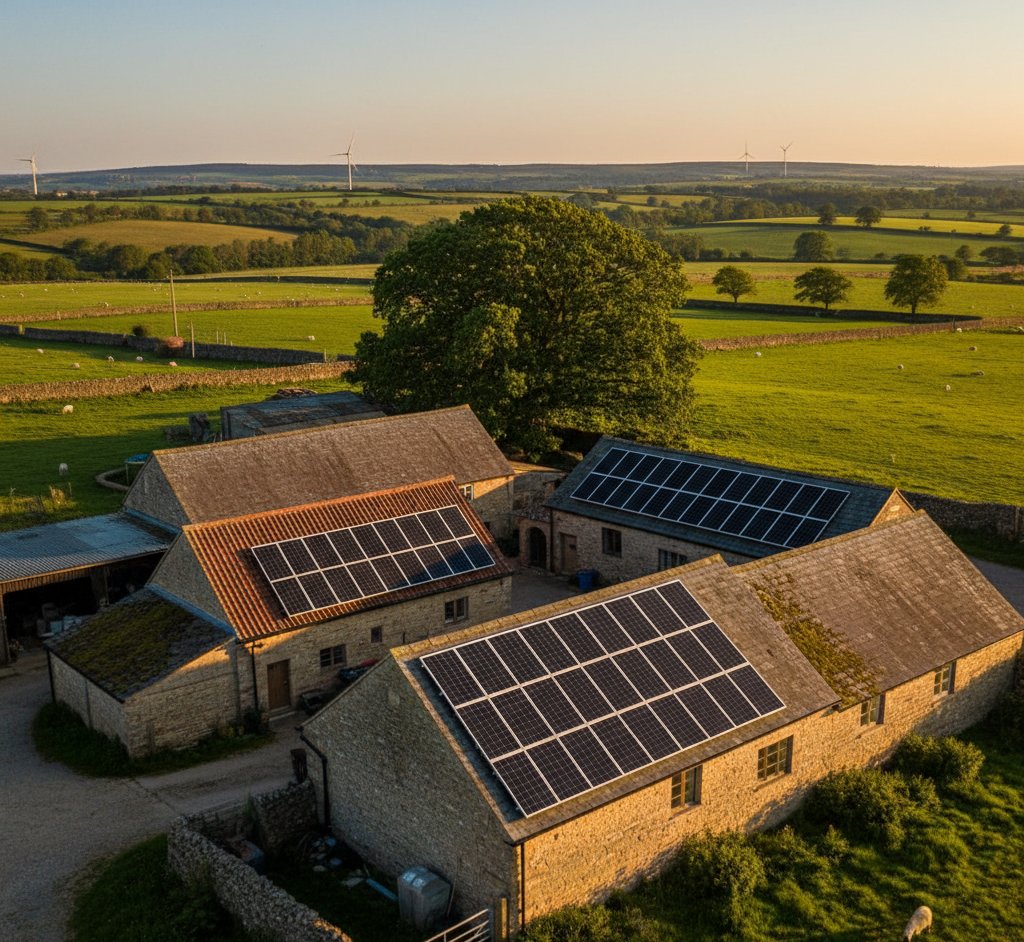
For most of England, annual irradiance for a south-facing roof at 30-40 degrees is around 900-1,000 kWh/kWp. Orientation factors are roughly: due south = 1.0, south-east or south-west = 0.95, east or west = 0.80-0.85.
So a 4 kW south-facing system in the Midlands might expect: 4 x 950 x 1.0 = 3,800 kWh/year. The same system facing east would expect: 4 x 950 x 0.82 = 3,116 kWh/year.
Year-on-year variation: Even a perfectly functioning system will vary by 5-10% year to year due to weather differences. One cloudy June can knock your annual total down noticeably. Don't panic about a single below-average year — look at multi-year trends.
Step 7: When to Call Your Installer
If you've worked through the steps above and can't identify the cause, or if you've found something that needs professional attention, here's when to make the call:
- Generation is consistently 30%+ below your MCS expected figure after accounting for seasonal variation — and you've had at least 12 months of data.
- The inverter is showing persistent error codes that don't clear themselves. Occasional grid frequency errors are normal; daily isolation faults are not.
- One or more panels are producing zero. If your monitoring shows individual panel data (optimiser or microinverter systems), a panel reading zero suggests a wiring issue, failed panel, or blown fuse in a combiner box.
- Visible damage to panels. Burn marks, heavy discolouration, cracked glass, or delamination should be reported promptly. These may be warranty claims.
- Burn marks or discolouration on the DC isolator, inverter, or cabling. This is a safety issue — contact your installer immediately.
Keep Records
When you do contact your installer, having data makes everything easier. Screenshot your monitoring app showing the problem period. Note the date the issue started, any error codes displayed, and what (if anything) changed around that time. "My generation seems low" is harder for an installer to investigate than "generation dropped 40% on 15 March and hasn't recovered — here's the graph."
The Reassuring Reality
Most domestic solar systems in the UK work reliably for decades with minimal intervention. Panels have no moving parts and are built to withstand UK weather. Inverters are the most likely failure point, and even they typically last 10-15 years before needing replacement.
If your system is generating within 10-15% of its MCS expected figure over a full year, it's performing normally. The sun is variable, weather is unpredictable, and no two years are identical. Resist the temptation to micro-analyse daily figures — look at monthly and annual trends instead.
The fact that you're monitoring your system at all puts you ahead of most solar owners. Many people never check after installation and wouldn't notice a genuine fault for months. Your attention to the numbers is a good thing — just make sure you're comparing against realistic benchmarks.
Share this article
OVO has carefully selected trusted teams across the UK to install solar panels and heat pumps. Enjoy the personal touch of a local expert with the peace of mind of a household name.
Affiliate link — we may earn a small commission at no extra cost to you
Stay informed
Get free solar updates direct to your inbox
Related reading

Month-by-Month Solar Generation in the UK: What to Actually Expect
Realistic monthly generation figures for UK solar panels by region. Based on MCS data, not optimistic marketing claims.
Roof Orientation and Solar: Direction Trade-Offs
How roof orientation affects solar panel performance in the UK. South, east, west, and north-facing roof output compared, plus split-orientation strategies.
Solar Panel Maintenance: What's Actually Needed?
The honest guide to solar panel maintenance in the UK — spoiler: it's less than you think. What you actually need to do, and what you can safely skip.

Switch to Octopus Energy
Get 50 credit when you switch. We get 50 too — win-win.
What does this mean for YOUR home?
Design your perfect solar setup in under 3 minutes. Free, no sign-up required.
Build Your Solar System