This page contains affiliate links. If you purchase through them we may earn a small commission at no extra cost to you. Learn more
Solar Panel Seasonal Guide: What to Expect Month by Month

Once your solar panels are installed, the job becomes understanding how they behave across the year — and knowing what to do, and when. UK solar output is far from even: you can generate thirteen times more in May than in December. Knowing what to expect each month helps you spot problems, time your maintenance, and make the most of what your system produces.
Annual output overview
The table below shows typical monthly generation for a south-facing UK system at mid-latitude (roughly the English Midlands). Generation is shown per kilowatt-peak (kWp) of installed capacity — multiply by your system size to estimate your expected output.
Annual total: approximately 856 kWh/kWp for a typical UK mid-latitude site. South England is roughly 10% higher (950–1,050 kWh/kWp); Scotland is roughly 15% lower (750–850 kWh/kWp).
A 4 kWp system at a mid-UK site should generate around 3,400 kWh per year. A 6 kWp system, around 5,100 kWh.
May is the peak — not midsummer
This surprises many solar owners. May beats June and July because longer days combine with cooler panel temperatures. Solar panels lose roughly 0.35% of their efficiency for every degree above 25°C. By June and July, roof-mounted panels on warm days can reach 55–65°C, which cuts output noticeably. May's cooler air keeps panels closer to their rated temperature while still offering long daylight hours. The result: more kWh in May than in either of the two months that follow it.
Month-by-month guide
January — ~29 kWh/kWp
January is the moment to look backwards before looking forwards. Pull up your inverter app or portal and find your total generation for the previous year. Compare it against the estimated annual output on your MCS certificate — the document you received when the system was installed. A difference of more than 10% from the estimate is worth investigating, though weather variation between years can account for some of this.
January is also when many suppliers update standing charges and unit rates. It is worth logging into your energy account and checking whether your current tariff still makes sense given the current standard flat rate of around 24p/kWh.
Download and archive last year's generation data now, before inverter portals roll over their logs — some only retain 12 months of history.
February — ~38 kWh/kWp
Output is still low but beginning to climb. On clear, cold February days you may notice higher-than-expected generation — cool temperatures keep panel efficiency up even when sun angles are still low.
Carry out a ground-level visual inspection of the panels. Look for anything that might have shifted or cracked during winter storms: displaced panels, loose flashing, or debris resting against the array. Binoculars help if the roof is high.
Check the inverter error log for any faults that appeared during winter. Overnight frost events occasionally trigger temperature-related warnings that clear themselves — but persistent error codes after a cold period are worth noting.
March — ~64 kWh/kWp
The spring equinox falls in late March and output climbs quickly from here. This is one of the most useful months in the solar calendar for owners who want to stay on top of their system.
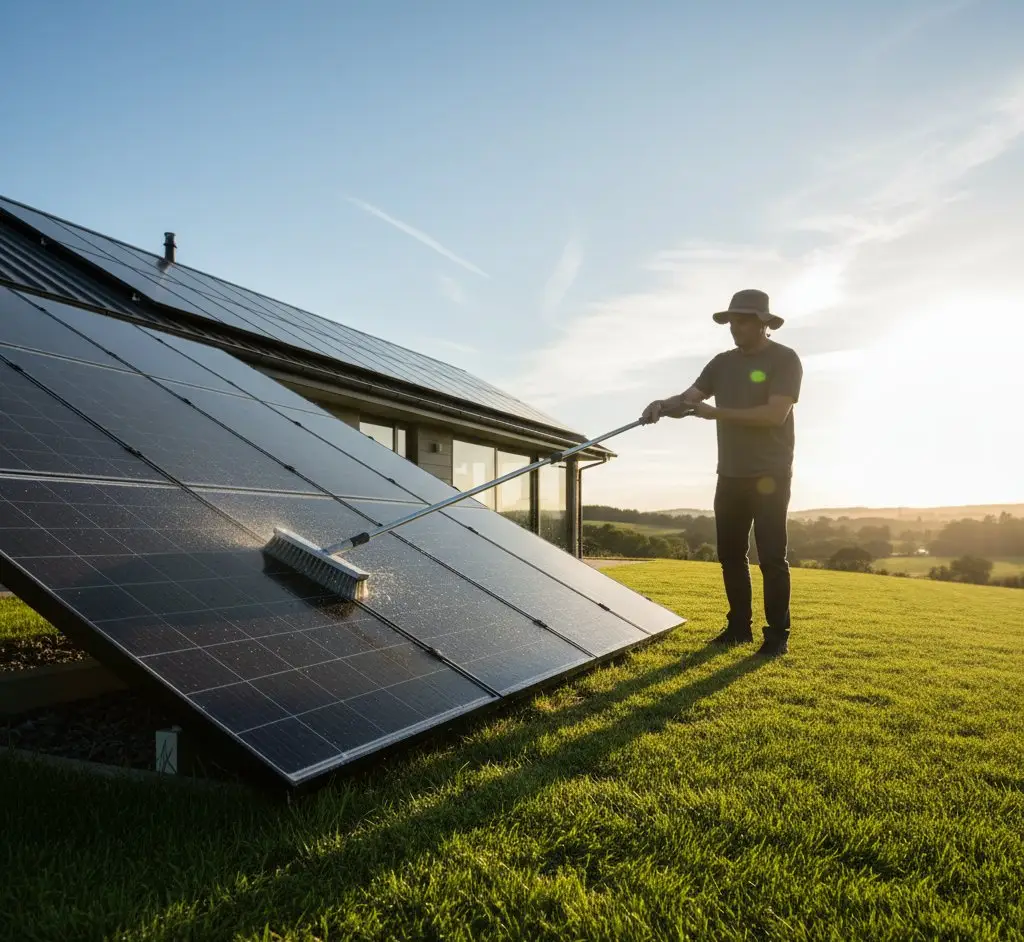
Clean the panels if they need it. Winter accumulates bird droppings and general grime, and removing this before peak season means you go into April and May with panels at full efficiency. A rinse with clean water from a hose and a soft brush is usually enough — see the cleaning guide for more detail.
Confirm your monitoring app is transmitting correctly. Some inverters lose their WiFi connection during winter due to router restarts or connectivity changes; if your app has shown no data for weeks, reconnect the inverter before output climbs.
If you are planning to add a battery or solar diverter this year, March is an ideal time to get quotes. Installer availability tightens significantly from April onwards as the spring rush builds.
April — ~99 kWh/kWp
April brings two things: strong solar output and a quarterly Ofgem price cap change.
The Q2 2026 price cap sets the standard unit rate at 24.5p/kWh and a standing charge of 55p/day. This is the moment to check whether your current tariff is still the best option. If you have a battery and are on a flat-rate tariff, a time-of-use tariff such as Octopus Go (5.5p overnight, 24p day rate) may now offer better overall economics — especially with the overnight rate having dropped significantly from April 2026.
Start shifting high-draw appliances to solar hours (roughly 10am–2pm on sunny days). Dishwashers, washing machines, and tumble dryers all work well on a solar timer. If your inverter has a companion diverter or immersion controller, check it is active and correctly configured.
Confirm that your Smart Export Guarantee (SEG) payments are arriving. SEG rates as of April 2026 range from around 3.3p to 15p per kWh depending on your supplier. If you have not reviewed your export tariff recently, it is worth checking whether a better rate is available.
May — ~119 kWh/kWp (peak)
This is the month your system performs at its best. A 4 kWp system at a mid-UK site might generate 475 kWh in May alone — roughly 14% of its annual output in a single month.
Maximise self-consumption. Run the washing machine, dishwasher, and any other high-draw appliances during peak solar hours. If you have an electric vehicle, charge it during the day rather than overnight where possible. If you have a hot water immersion heater, a solar diverter directing surplus to hot water is particularly effective in May.
If you have a battery, check it is cycling correctly and that no degradation alarms are showing. A battery that takes in a full charge each day and discharges fully each evening is working exactly as intended.
If you have been considering adding a battery and have not yet done so, installing in May still captures the remaining peak months this year — it is better than waiting until autumn.
Monitor your generation data against the table above. If your system is producing significantly less than expected for the conditions, investigate before the peak months pass.
June — ~115 kWh/kWh
Near-peak generation continues. Export volumes will be high if your household cannot absorb all the generation — if you are on a fixed SEG export tariff, it is worth checking whether a variable export tariff such as Agile Outgoing might increase your export earnings.
Hot weather may begin to clip panel efficiency. If ambient temperatures rise above 35°C, your panels could be running at 55–65°C, reducing output by 10% or more compared to the panel's rated performance. This is expected and not a fault — but it explains why June sometimes produces slightly less than May despite longer days.
Check that the ventilation gap beneath your panels has not been blocked by debris or nesting material. Panels need airflow to shed heat.
This is also a good month to benchmark your system: compare your output against online tools such as PVGIS or PVOutput.org to see whether your system is in line with what similar systems in your area are producing.
July — ~114 kWh/kWp
The Ofgem price cap changes again in July. Check whether your unit rate or standing charge has moved and whether a tariff switch makes sense.
Heat continues to reduce panel efficiency on the hottest days. Your inverter is also affected — inverters lose efficiency when hot, and should not be installed in direct sunlight or enclosed spaces without ventilation. If your inverter feels very hot to the touch on a warm afternoon, check that its ventilation is unobstructed.
July is a practical month for a more detailed system check. Inspect the DC isolator (located near the panels or on an external wall) for any signs of discolouration or water ingress. Discolouration or melting around a DC isolator is a serious safety concern — see the maintenance checklist for guidance on what to do if you spot this.
August — ~101 kWh/kWp
Output is declining from the midsummer peak but still strong. If you plan to add extra panels or make other changes to the system, August is a good time to get installer quotes — installers tend to be less busy than in spring, and quotes may be more competitive.
Begin planning any system additions you want in place before next spring: additional panels, a battery, or a solar diverter. Lead times from MCS installers can be three to six months in popular areas.
Bird proofing installation is not permitted during the nesting season (1 March–31 August). The window to arrange bird proofing opens in September — see the warning below.
September — ~75 kWh/kWp
The autumn decline becomes noticeable in September. Output drops by roughly a quarter compared to August, and the evenings draw in quickly.
This is the month to review your summer performance. Compare May–August generation against the same period in previous years, or against the estimates in your MCS certificate. If there is a gap, September is still warm enough for an installer to investigate without winter complicating access.
The bird proofing installation window opens in September. If you noticed nesting activity under or around your panels during spring or summer, now is the time to arrange installation — before next year's nesting season begins in March.
Begin transitioning your battery strategy if you have a battery. Through summer, you may have been relying primarily on daytime solar surplus to fill the battery. From September onwards, shifting to overnight cheap-rate charging (using a time-of-use tariff such as Octopus Go at 5.5p/kWh overnight) and using stored energy to cover dark evenings becomes more useful.
Bird nesting season: plan your bird proofing carefully
Under the Wildlife and Countryside Act 1981, it is illegal to disturb or destroy an active bird nest. This applies to solar panel bird proofing installation — you cannot legally have mesh or proofing installed between 1 March and 31 August if birds are nesting under or near the panels. The safe installation window is September to February. If you want bird proofing in place before the next nesting season, arrange it in autumn. Do not leave it until February — good installers book up quickly.
October — ~47 kWh/kWp
October brings the second major Ofgem price cap change of the year. This update often reflects winter wholesale pricing and can move unit rates materially. Review your tariff as soon as the new rates are announced — October is one of the most important tariff review points of the year.
If you have a battery, switch firmly to a winter charging strategy: charge from cheap overnight rates and use stored energy during dark evenings. Solar generation in October will rarely fill a battery on its own. A household on Octopus Go charging at 5.5p/kWh overnight and avoiding peak grid imports during evenings can still save meaningfully, even as solar output falls.
Accept that your system is entering its low season. Output in October is below half of May's peak. This is expected, not a fault.
November — ~30 kWh/kWp
November output is close to winter levels. The most important thing in November is making sure your monitoring is still working — low generation makes it easy to miss a fault. A panel or string failure that drops output by 20% is hard to notice when base generation is already low. Check your monitoring app actively rather than waiting for an alert.
If you have a battery, it becomes proportionally more valuable in November than at any other time of year. Stored overnight cheap-rate electricity covers dark evenings when solar produces nothing. The economics of a battery on a time-of-use tariff are often strongest in the winter months.
Review your home's insulation and draught-proofing. Reducing heating demand is the most cost-effective complement to solar in winter — a well-insulated home needs less energy regardless of what your panels are producing.
December — ~25 kWh/kWp
December is the lowest-output month. Do not draw conclusions about your system's health from a single winter month's data — annual comparison is the meaningful metric.
On clear winter days, even December panels produce something. Short, bright days can generate several kWh. Winter is not zero output; it is simply low output.
Complete your year-end data archive. Download your full year's generation data from your inverter portal before logs roll over. Record your generation meter reading. If your system is more than a few years old and you have not had a professional check in that time, early December — before the mid-winter slowdown — is a reasonable time to arrange one.
Plan any system upgrades for Q1 next year. Battery installations, additional panels, and diverter additions all benefit from being commissioned before the spring peak. If you want to capture May at full capacity, your installer needs to be on site by March at the latest.
Putting it all together
Your solar system rewards attention at particular moments in the year rather than constant monitoring. The key anchor points are:
- Spring (March–April): clean panels, inspect for winter damage, review tariff after April price cap change
- May: maximise self-consumption at peak output
- September: arrange bird proofing if needed, shift to winter battery strategy
- October: major tariff review after price cap change, commit to winter charging approach
- December–January: annual data review, compare against MCS estimate, archive generation records
For a deeper look at annual maintenance tasks, see the solar maintenance checklist. For advice on keeping output high through winter, see solar panels in winter and cloudy weather. For tariff options, including time-of-use tariffs that work well with batteries, see the tariff and battery storage guide.
Share this article
Stay informed
Get free solar updates direct to your inbox
Related reading
Annual Solar Panel Maintenance Checklist
A simple annual maintenance checklist for UK solar panel owners. What to check, when to check it, and when to call a professional.

How to Get the Most from Your Solar Panels: 12 Practical Tips
12 practical ways to maximise your solar panel output and savings in the UK. From free habits to smart upgrades.
Do Solar Panels Work in Winter and on Cloudy Days?
Yes, solar panels work in winter and on cloudy days in the UK. Here is how much they actually generate month by month.

Switch to Octopus Energy
Get 50 credit when you switch. We get 50 too — win-win.
What does this mean for YOUR home?
Design your perfect solar setup in under 3 minutes. Free, no sign-up required.
Build Your Solar System