This page contains affiliate links. If you purchase through them we may earn a small commission at no extra cost to you. Learn more
Solar Winter Performance Audit: Underperforming or Just December?
You installed solar panels, spent the summer watching those satisfying numbers climb, and then December arrived. Suddenly you're staring at a daily generation figure that looks like a rounding error. The monitoring app shows 1.8 kWh for the whole day. You start wondering whether something is wrong — or worse, whether you were misled about what solar could do.
The honest answer, in the vast majority of cases, is that your system is working exactly as it should. What you're experiencing is physics, not a fault. This guide gives you the tools to tell the difference.
What's Normal in Winter: The Honest Numbers
UK solar generation follows a steep seasonal curve. The long, high-angle days of June are around four to five times more productive than the short, low-angle days of December. This is not a design flaw — it is the consequence of living at 50–58 degrees north latitude.
Here is what that looks like in practice. A 4 kWp south-facing system in central England typically generates around 3,400–3,800 kWh per year. That does not arrive in neat monthly parcels of 300 kWh. The actual monthly distribution looks more like this:
The four months from May to August account for roughly 55% of annual generation. The four winter months of November through February account for around 13%. When you look at those numbers, a 4 kWp system producing 1–3 kWh on a cloudy December day is behaving exactly as designed.
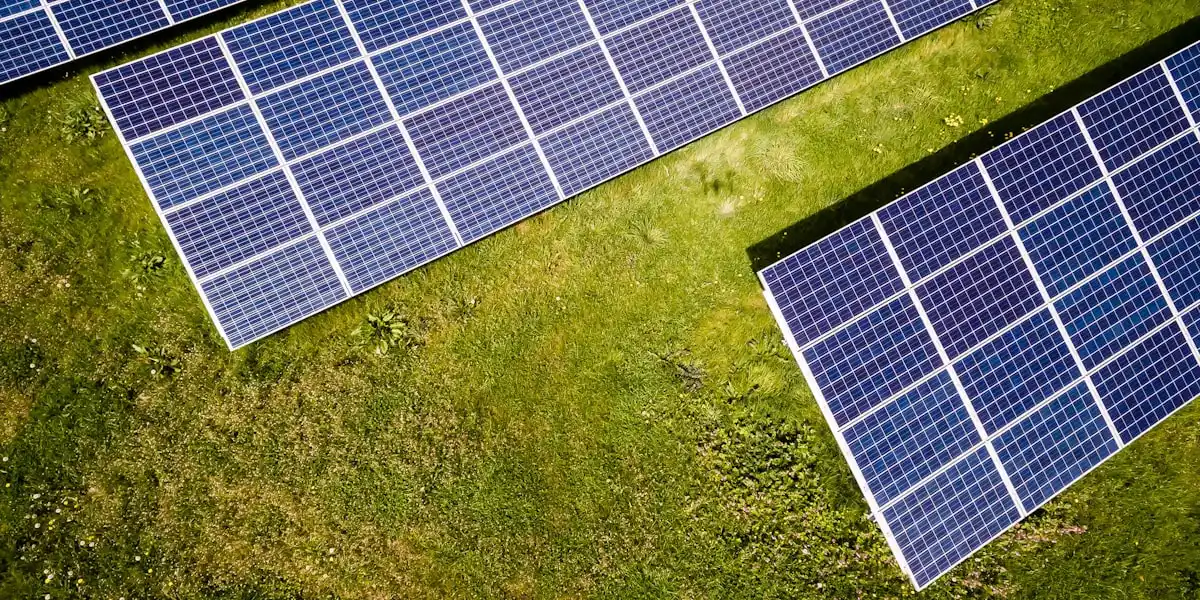
On a clear, bright winter day that same system might produce 6–9 kWh. On a heavily overcast one, 0.5–1.5 kWh. Both are within the normal range.
Screenshot Your Monthly Totals
Take a screenshot of your monitoring app at the end of each month and save it to a dedicated folder on your phone. After 12 months you will have a full seasonal profile for your actual system that you can use as a baseline for every year thereafter. Patterns are invisible until you can see them side by side.
Monthly Benchmarks by UK Region
Location matters. The south coast of England receives around 25–30% more solar irradiance than the north of Scotland. These regional figures show typical kWh per kWp (see explanation below) for a south-facing system at 30–40 degrees tilt:
These figures are indicative averages derived from UK irradiance data and are intended as a benchmarking guide, not a guarantee. Real-world output also depends on your exact roof orientation, tilt angle, any shading, and your inverter's efficiency. A due-south 35-degree roof will be at the top of the range; a south-west 25-degree roof will sit toward the middle or lower end.
Set a March Reminder Now
January and February are a poor time to draw conclusions about solar performance. Set a calendar reminder for the first week of March each year. By that point, generation is picking up noticeably and you will have a meaningful data point to compare against February figures. March alone typically produces three times the output of December.
How to Benchmark Your Own System
You need two pieces of information: your system size in kilowatts-peak (kWp) and your actual monthly generation in kWh.
Step 1: Find your system size
Your system size in kWp is on:
- Your MCS certificate (your installer should have given you this at handover)
- The original installer quote or contract
- Your inverter's data plate or manufacturer app — the inverter is sometimes sized slightly lower than the panel array, so check both
Step 2: Find your monthly generation total
Open your monitoring app (GivEnergy, SolarEdge, Solis Cloud, SunSynk, Fronius Solar.web, etc.) and look for monthly summary data. Most apps display a month-by-month bar chart. You want the total kWh generated for the calendar month you are checking.
If your WiFi monitoring has gaps or dropouts, your generation meter — a small meter usually mounted near the inverter — records total lifetime generation regardless of internet connectivity. Subtract last month's reading from this month's to get an approximate monthly figure.
Step 3: Calculate your specific yield
Divide your actual monthly kWh by your system size in kWp. This gives you your specific yield for that month.
Specific yield = Actual kWh ÷ System size in kWp
For example: a 4.2 kWp system that generated 78 kWh in December has a specific yield of 78 ÷ 4.2 = 18.6 kWh/kWp.
Step 4: Compare against the regional table
Take that specific yield figure and find your region and month in the table above. If you are within 20% of the mid-range benchmark for your region, your system is performing normally.
Using the example above: 18.6 kWh/kWp in December in the North of England. The benchmark range for North England in December is 13–18 kWh/kWp. At 18.6 you are slightly above the top of the range — excellent performance.
If the same system generated 42 kWh in December (specific yield: 10 kWh/kWp), that would be well below the North England range of 13–18 and worth investigating further.
Free tools to cross-check
- Sheffield Solar PV_Live — Shows real-time and historical aggregated solar output across GB. Useful for seeing whether other systems in your area were generating on the same days you are questioning.
- PVGIS — The European Commission's solar irradiance database. You can enter your postcode, system size, and orientation to get a monthly generation estimate specific to your location.
- Solcast — Offers free rooftop solar forecasting. Register your system and it will tell you what your panels should have produced in the last seven days based on actual satellite-measured irradiance for your location. Useful if you suspect a recent drop.
When Winter Output Is a Genuine Problem
The seasonal curve explains most winter anxiety. But real faults do exist, and they look different from normal seasonal variation.
Signs of genuine underperformance in winter:
Your specific yield is more than 40–50% below the regional benchmark. Seasonal variation and weather fluctuation might put you 15–20% below average. Being half the expected figure suggests something is wrong.
Zero generation on days when other systems are working. If your monitoring shows zero output on a day when Sheffield Solar's regional data shows positive generation, and your area has not been foggy all day, something has interrupted your system. Check the inverter first.
A sudden step-change in output. If your monitoring history shows a consistent pattern and then a sharp, permanent drop — not correlated with a change of season — that is a fault signature. Weather-related variation is gradual and correlates with overcast or short days. A fault shows as an abrupt, unexplained change.
One string generating noticeably less than another. If your inverter or monitoring system shows multiple strings separately, and one string consistently produces significantly less than the others, that string has a problem. Possibilities include a failing panel, a loose DC connector, or damage to a cable.
Inverter error codes or fault indicator lights. Check the inverter's display panel. Common winter-relevant fault codes include earth/isolation faults (often triggered by moisture ingress into a panel junction box or DC connector), grid voltage errors (usually a grid-side issue, not your system), and arc fault warnings (a loose connection in the DC wiring — requires professional investigation).
Generation that plateaus at the same level repeatedly. If your generation graph shows output that regularly hits a ceiling and stays flat — for example, always stops at exactly 1.6 kW even on clear days — your inverter may be curtailing output. This can be caused by export limiting settings, a firmware issue, or thermal throttling.
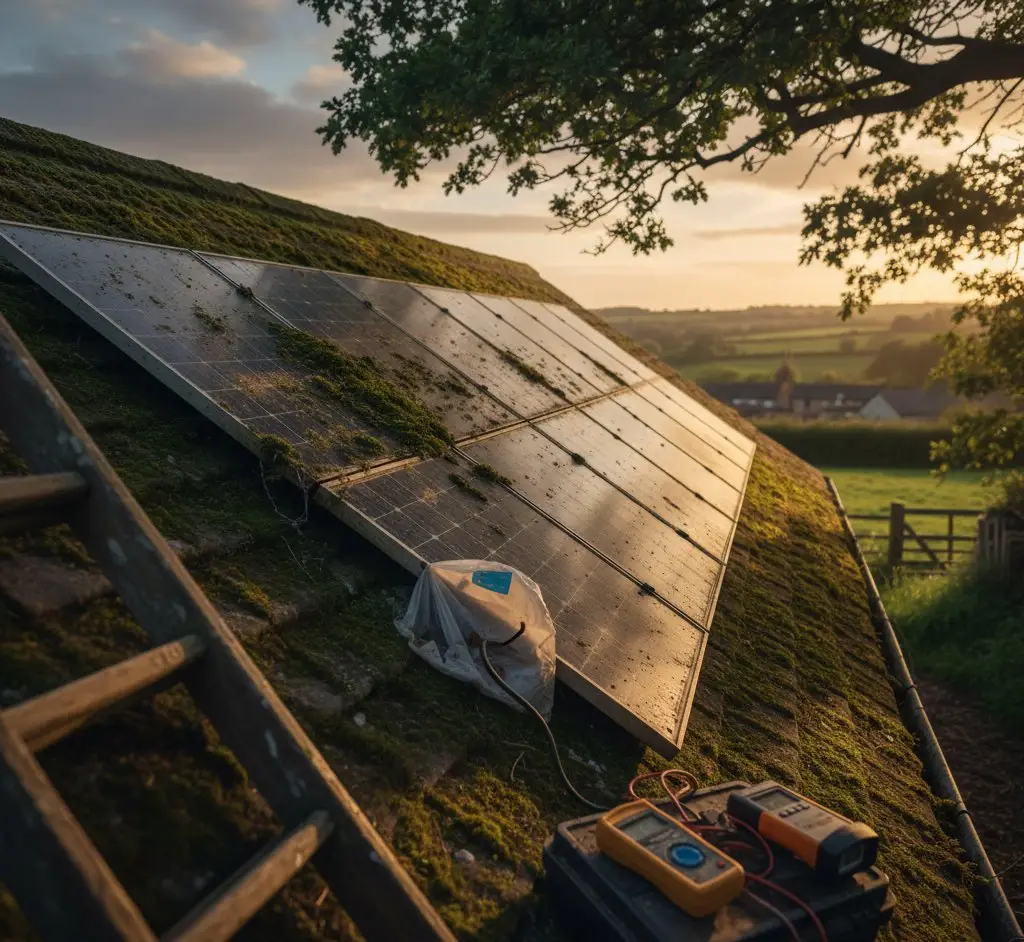
Do Not Climb on the Roof
In winter the roof surface may be wet, icy, or covered in frost even when it does not look it. Do not attempt to inspect panels from the roof yourself. All visual checks should be done from ground level with binoculars. If you need a physical panel inspection, contact your installer or a qualified solar electrician.
Common Winter-Specific Issues
Beyond the generic fault list, a handful of issues are specific to winter conditions:
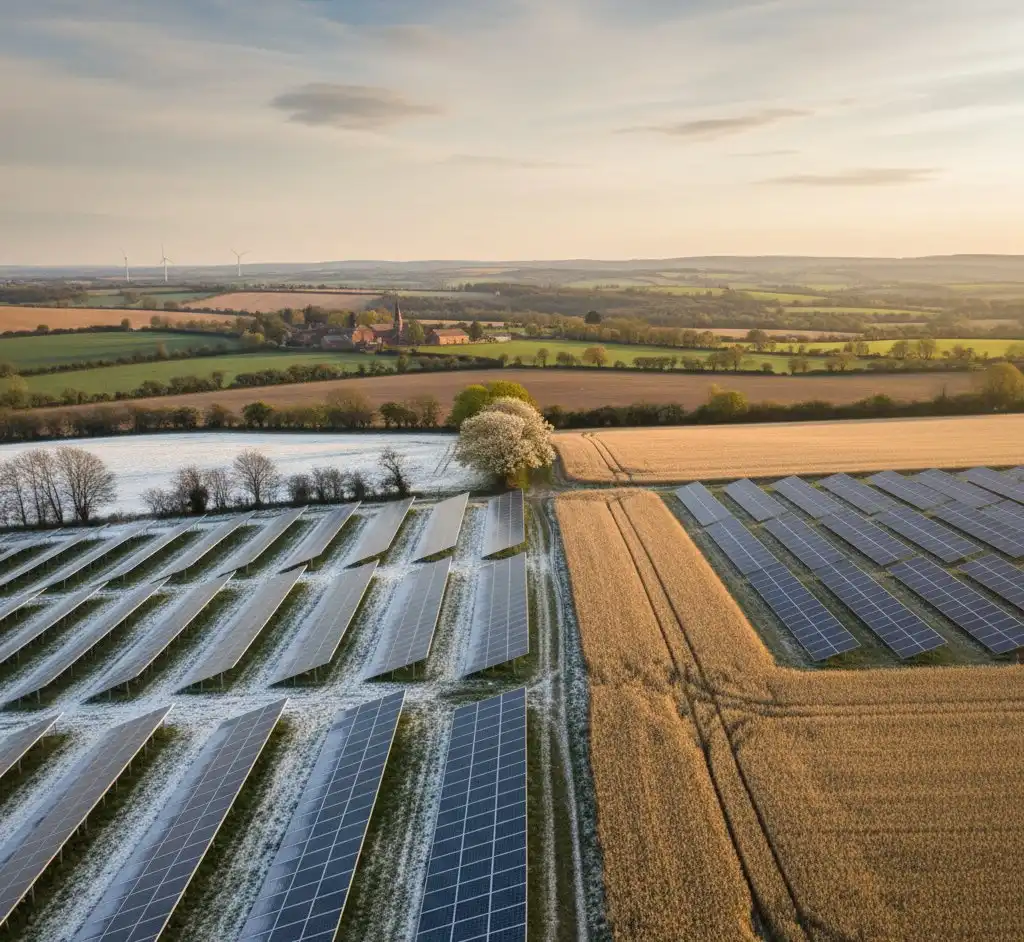
Snow cover. Snow on panels blocks generation entirely, but most UK snowfall is light enough that panels clear within a few hours. The panel surface is warm, smooth, and slightly angled — snow slides off on its own. A heavy, persistent snowfall might suppress generation for a day. Do not attempt to sweep snow from panels yourself, for the reasons above.
Low winter sun angle and shading. In summer, the sun arcs high across the sky and your chimney stack may cast no shadow on the panels at all. In winter, the sun tracks low along the southern horizon. Objects that don't shade your panels in summer — a chimney, a dormer, a nearby tree, a neighbouring roof — may now cast significant shadows during the hours of peak winter generation. If your output is lower than the benchmark, observe your roof on a clear midday in December or January and note any shadows. This is a real and common cause of winter underperformance that is not a fault — it's a site characteristic.
Condensation inside inverters. In unheated garages, condensation can form inside inverters during cold nights and cause temporary isolation faults in the morning. The fault usually clears as the inverter warms up. If you see early-morning fault codes that resolve by mid-morning, this is the likely cause. Improving ventilation in the space or adding a small heater can help.
Inverter cold-start delay. Many inverters have a built-in startup delay — they wait for irradiance to reach a minimum threshold before connecting to the grid. On very overcast winter days, this threshold may not be reached until mid-morning, and the inverter may disconnect again mid-afternoon. This is normal protective behaviour, not a fault.
Checking the Installer's Original Estimate
If you are worried that you were misled during the sales process, you can audit the installer's generation estimate against what is physically reasonable.
Take the annual generation figure your installer quoted. Divide it by your system size in kWp. This gives you the projected specific yield:
Projected specific yield = Quoted annual kWh ÷ System size in kWp
For central England, a physically realistic specific yield for a south-facing 35-degree system is around 900–980 kWh/kWp per year. For the south coast, up to 1,050 kWh/kWp. For Scotland, closer to 800–880 kWh/kWp.
If your installer's quoted specific yield is significantly above these figures — say, 1,200 kWh/kWp for a system in Yorkshire — the estimate was optimistic. Your system may be generating exactly what physics allows, while the original projection was unrealistic.
The MCS certificate your installer provided at handover includes a calculated expected annual generation based on standardised irradiance data for your location. If you have this document, that MCS figure is a more reliable benchmark than any sales estimate. Compare your actual annual generation against the MCS figure, not against the salesperson's projection.
If your actual generation is consistently 85–100% of the MCS expected figure over a full year, your system is working correctly. If it is consistently below 75% of the MCS figure for reasons you cannot explain (shading, orientation differences), that is grounds for a conversation with your installer.
If You Find a Real Problem
Start with your installer. They have a post-installation obligation under MCS rules to address legitimate faults. Put your concern in writing (email is fine) and include your monitoring data. A reputable installer will arrange an inspection.
Check your warranty documents. Panels typically carry a 25-year product warranty and a 25-year performance warranty (guaranteeing a minimum percentage of rated output). Inverters carry 5–12 year warranties depending on the brand and any extended warranty you purchased. If a component is faulty, these warranties are your first recourse.
If your installer is unresponsive or has ceased trading, the MCS Complaints process is available at mcscertified.com. MCS can provide guidance on dispute resolution and, in some cases, connect you with a resolution service. For more detail, see our guide on what to do if your installer goes bust.
If you suspect a safety issue — burning smells, scorch marks, discolouration around DC connectors or the inverter, or your RCD tripping repeatedly in connection with the solar system — turn off your solar AC isolator, contact a qualified solar electrician, and do not delay.
The Reassuring Reality
Your panels have been working in the cold, wet, low-light conditions of a UK winter without complaint, generating free electricity from whatever light was available. December in the United Kingdom offers about seven hours of low-angle daylight. The sun reaches only 15 degrees above the horizon at noon. It is frequently overcast. Generating 1–3 kWh on that kind of day is not a failure — it is a small engineering triumph.
The solar industry's dirty secret is that many buyers focus on the summer figures during the sales process and then feel disappointed by winter. The system they were sold is often performing exactly as physics and the MCS calculation predicted. The disappointment comes from unrealistic expectations about winter, not from a faulty system.
March changes everything. By the spring equinox, day length has equalised with night, the sun angle is rising, and generation will be three times what it was in December. By May you will be back to the numbers that made you excited about solar in the first place.
If you have run through this audit and something still does not add up, the underperforming solar diagnostic checklist takes you through a step-by-step fault investigation including monitoring dropouts, shading, panel condition, and inverter errors.
Share this article
Smart home energy monitoring and automation — track your solar generation and control your home with Wi-Fi devices
Affiliate link — we may earn a small commission at no extra cost to you
Stay informed
Get free solar updates direct to your inbox
Related reading
Seasonal Solar Generation Profiles UK
How solar panel output varies by season in the UK. Monthly generation profiles, winter vs summer output, and what this means for your energy bills.
My Solar Panels Are Underperforming: A Diagnostic Checklist
Solar not generating what you expected? Work through this checklist before calling your installer. Most underperformance has a simple explanation.
Best Solar Monitoring Apps UK 2026: Every Brand Compared
Solar monitoring app comparison for UK homes. GivEnergy, SolarEdge, Enphase, Huawei, and Home Assistant compared side by side.

Switch to Octopus Energy
Get 50 credit when you switch. We get 50 too — win-win.
What does this mean for YOUR home?
Design your perfect solar setup in under 3 minutes. Free, no sign-up required.
Build Your Solar System