This page contains affiliate links. If you purchase through them we may earn a small commission at no extra cost to you. Learn more
How Much Electricity Do Solar Panels Generate in the UK?
The number everyone wants first
Let's start with the headline figures before the nuance. For a south-facing, unshaded roof in the UK:
| System size | South England (kWh/year) | Midlands (kWh/year) | Scotland (kWh/year) |
|---|---|---|---|
| 3kW (7–8 panels) | 2,550–2,850 | 2,400–2,700 | 2,100–2,400 |
| 4kW (9–10 panels) | 3,400–3,800 | 3,200–3,600 | 2,800–3,200 |
| 5kW (12–13 panels) | 4,250–4,750 | 4,000–4,500 | 3,500–4,000 |
| 6kW (14–15 panels) | 5,100–5,700 | 4,800–5,400 | 4,200–4,800 |
The average UK household uses approximately 3,500 kWh per year (Ofgem figures). A well-sized 4kW system in most of England can therefore cover a large proportion of a typical household's demand — though not all of it, because solar generates when you may not be consuming.
3,600 kWh
typical annual output of a 4kW south-facing system in England — roughly equal to average household consumption
See what your roof could generateHow UK irradiance varies by location
Solar irradiance — the amount of solar energy falling per square metre — varies significantly across the UK. The main driver is latitude and associated cloud cover patterns.
Peak sun hours per year (approximate):
- Cornwall / Devon: 1,100–1,200 hours
- Kent / East Anglia: 1,050–1,150 hours
- South Wales / West Midlands: 950–1,050 hours
- Yorkshire / North West England: 900–1,000 hours
- North East England: 875–975 hours
- Central Scotland: 850–950 hours
- North-west Scotland / Orkney: 750–875 hours
These figures represent "peak sun hours" — a standardised measure of daily irradiance equivalent to 1,000W/m². It's the figure used in solar calculations and generation estimates.
The difference between the sunniest and least sunny parts of the UK is roughly 30–35%. That's meaningful, but it doesn't change the fundamental case for solar: even Scotland's irradiance levels are viable for a financially sensible solar installation, particularly with rising electricity prices.
Seasonal variation: the 3:1 ratio
This is the most important thing to understand about UK solar generation. The variation between summer and winter is dramatic.
A rough guide for a 4kW south-facing system in central England:
| Month | Typical daily generation |
|---|---|
| June / July | 18–22 kWh |
| April / May / August | 12–16 kWh |
| March / September | 8–12 kWh |
| October / February | 4–6 kWh |
| November / January | 1.5–3 kWh |
| December | 1–2 kWh |
The ratio between peak summer days and midwinter days is roughly 10:1. Over a full month, summer generation is about 3 times higher than winter generation.
This matters enormously for how you think about self-sufficiency. In summer, a 4kW system will generate far more than most homes use on many days — you'll be exporting. In December and January, you'll be generating barely enough to cover your standby loads, and you'll be pulling heavily from the grid.
The practical implication: don't expect solar to solve your winter electricity bill. It helps year-round, but the real payback comes in spring, summer, and autumn. A battery helps smooth the daily variation; it can't solve the seasonal gap.
Use an EV or immersion heater to absorb summer surplus
In summer, a south-facing 4kW system on a sunny day generates more than most households use. Without a battery or a smart diverter, that surplus exports at 5–10p/kWh. Running a myenergi Eddi to heat your hot water tank, or a Zappi to charge your EV, can absorb that surplus and save you money that would otherwise cost 25p+ to replicate from the grid.
Direction and pitch: how much does it matter?
Solar panels produce maximum output when facing directly at the sun. In the UK, the optimal orientation is:
- Direction: Due south (180°)
- Angle: 30–40° from horizontal (roughly typical UK roof pitch)
What happens when you deviate from this ideal?
| Orientation | Typical output vs south-facing |
|---|---|
| South (180°) | 100% (baseline) |
| South-east (135°) | 93–96% |
| South-west (225°) | 93–96% |
| East (90°) | 75–85% |
| West (270°) | 75–85% |
| North (0°) | 50–65% |
East-west split arrays (panels on both sides of a pitched roof) are increasingly popular. You sacrifice some total output, but generation is spread across more of the day — peaking in the morning and again in the afternoon rather than just at midday. For households that use electricity throughout the day, this can improve self-consumption even if total kWh is slightly lower.
A flat roof (0–10° angle) loses around 10–15% versus an optimal angle and can suffer from soiling more quickly, but it does allow you to orient panels freely using mounting frames.
The pitch matters less than people expect. A roof at 20° versus 40° loses only 2–5% of output for south-facing panels. Don't let a slightly shallow or steep pitch deter you.
Real-world vs theoretical output
Every solar panel has a rated output — a 450W panel is rated at 450W under Standard Test Conditions (STC): 1,000 W/m² irradiance, 25°C cell temperature, AM 1.5 spectrum. Real UK rooftop conditions differ.
Typical losses in a real installation:
| Loss factor | Typical reduction |
|---|---|
| Temperature (cells run hot) | 3–8% |
| Wiring and connection losses | 1–3% |
| Inverter efficiency losses | 2–3% |
| Soiling | 1–3% |
| Mismatch between panels | 1–2% |
| Total real-world derating | 8–19% |
A system rated at 4kW (9 × 450W panels, theoretical) will typically have a "performance ratio" of 75–85%, meaning it delivers 75–85% of the theoretical maximum kWh over the year. This is not a fault — it's expected and built into proper generation estimates.
When getting quotes, ask installers to show their generation estimate in kWh/year, not just system size in kWp. A credible quote will use a tool like PVGis (the EU-funded solar radiation database used by industry) rather than back-of-envelope calculations.
A note on degradation over time
New panels generate slightly more than they will in year 10 or year 20. Panel degradation is typically 0.5–0.8% per year (see our lifespan guide for detail). Over 25 years, a panel rated at 450W might be producing 425–440W — a small but real reduction. Long-term generation estimates should account for this.
A 4kW system generating 3,600 kWh in year one might generate 3,200–3,400 kWh in year 20, all else being equal. For financial modelling, use a mid-life figure rather than first-year output.
These popular panels offer excellent generation for UK conditions:
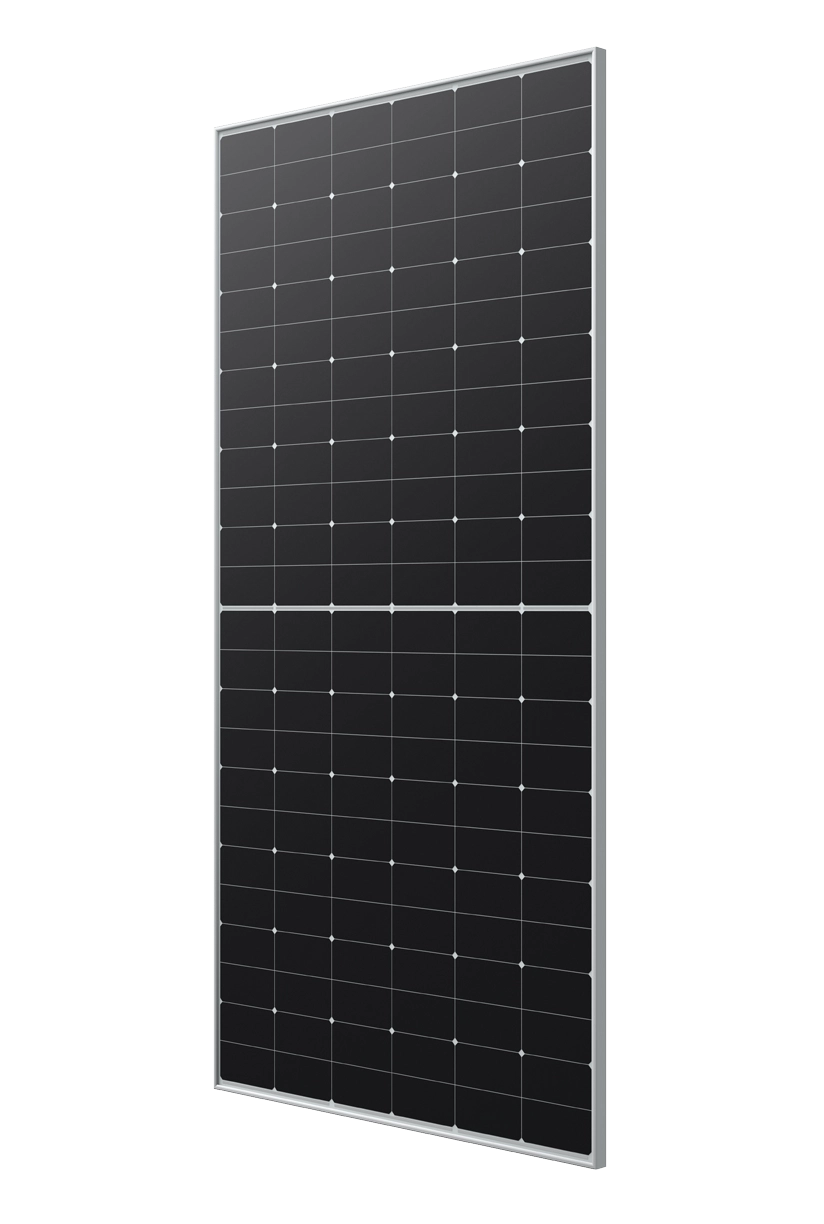
LONGi Hi-MO X6 450W
£85450
23
1722 x 1134 x 30
21.3
Affiliate link — we may earn a small commission at no extra cost to you
JA Solar JAM54D41 450W N-type TOPCon
£82450
22.8
1722 x 1134 x 30
21.5
Affiliate link — we may earn a small commission at no extra cost to you
How to get an accurate estimate for your roof
The most accurate generation estimate uses:
- Your specific location (postcode-level irradiance data from PVGis or similar)
- Your roof's orientation and pitch (measured, not guessed)
- Any shading analysis (horizon shading, nearby buildings, trees)
- System size and panel specifications
- Inverter efficiency
A reputable installer will produce a site-specific generation estimate as part of their survey. Be wary of anyone who gives you a round-number "you'll generate enough to cover your bills" without showing the kWh workings.
Our quiz can give you a quick personalised estimate based on your postcode and roof details.
Energy independence meter
What percentage of your electricity comes from your own roof? Slide to explore.
Generated
3,600 kWh
Self-used
1,440 kWh
From grid
2,060 kWh
Grid cost
£505/yr
Share this article
OVO has carefully selected trusted teams across the UK to install solar panels and heat pumps. Enjoy the personal touch of a local expert with the peace of mind of a household name.
Affiliate link — we may earn a small commission at no extra cost to you
Stay informed
Get free solar updates direct to your inbox
Related reading

How Do Solar Panels Work? A Simple Explanation
A plain-English explanation of the photovoltaic effect, how solar electricity gets from your roof into your home, and what happens at night or on cloudy days.

Is My Roof Suitable for Solar Panels?
Find out if your roof can take solar panels — covering direction, angle, shading, structural condition, and options for tricky roofs.
Solar Panel Efficiency: What It Means and Why It's Not Everything
Panel efficiency explained plainly — what the percentage actually means, why the gap between 20% and 22% barely matters for most UK homes, and what you should actually be comparing.

Switch to Octopus Energy
Get 50 credit when you switch. We get 50 too — win-win.
What does this mean for YOUR home?
Design your perfect solar setup in under 3 minutes. Free, no sign-up required.
Build Your Solar System