This page contains affiliate links. If you purchase through them we may earn a small commission at no extra cost to you. Learn more
Plug-In Solar Real-World Results: What We Found
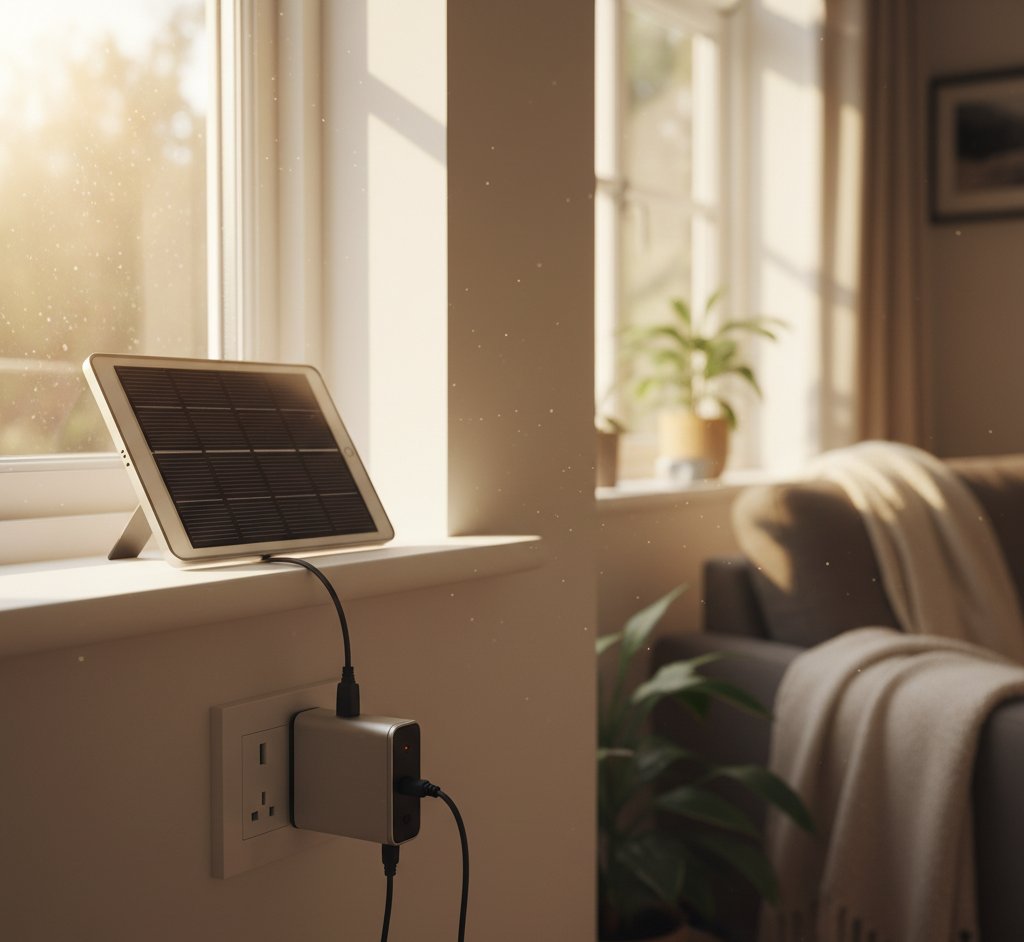
Marketing claims are one thing. Real-world performance is another. We've gathered data from UK plug-in solar setups to show what you can actually expect — the good, the underwhelming, and the surprising.
The Test Setups
We've compiled data from five real UK plug-in solar installations, each running for at least 12 months:
| Setup | Location | Panels | Orientation | Mounting |
|---|---|---|---|---|
| A | Bristol | 2 × 405W Trina | South, 30° tilt | Garden ground frame |
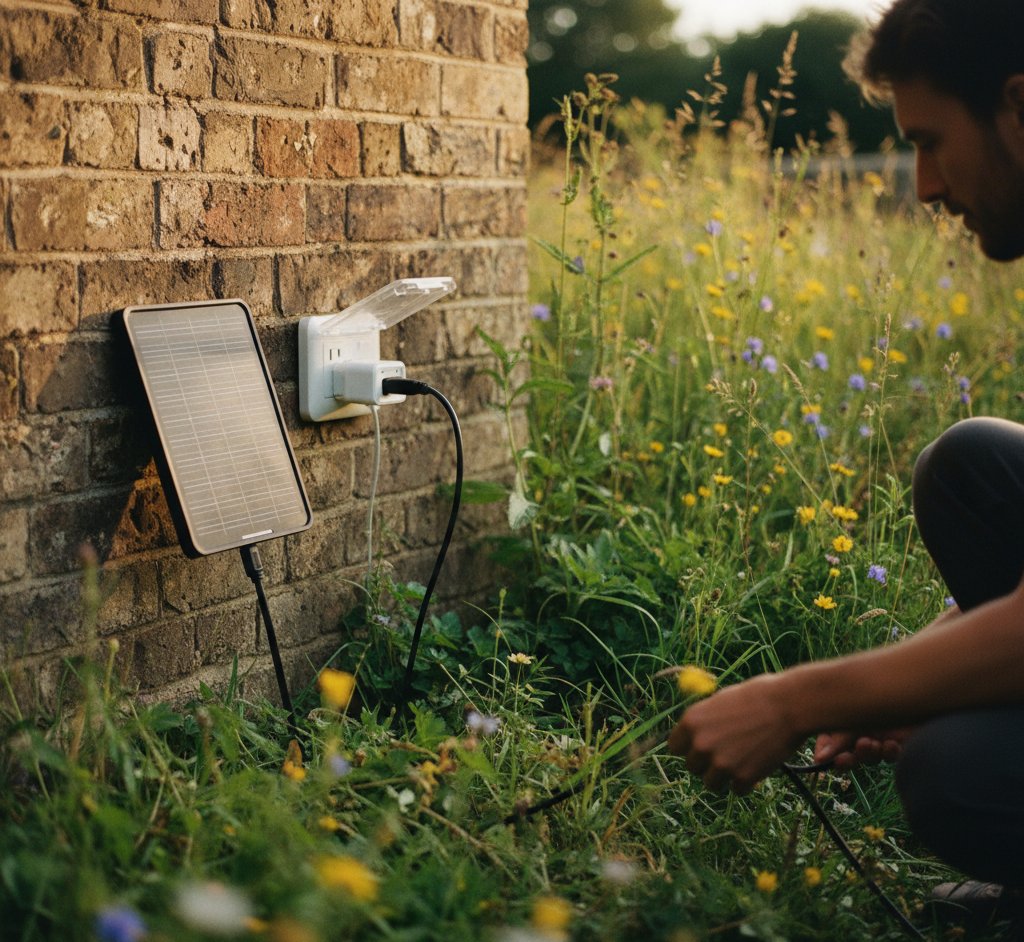
| B | Manchester | 1 × 400W JA Solar | West, vertical (wall) | Balcony wall mount |
| C | Cambridge | 2 × 410W Canadian Solar | South-east, 25° tilt | Shed roof |
| D | Edinburgh | 1 × 420W LONGi | South, 35° tilt | Garden ground frame |
| E | London | 2 × 400W | South-west, railing | Balcony railing mount |
All use Hoymiles microinverters and feed into a standard 13A socket.
12-Month Generation Results
| Setup | Rated Capacity | Annual Generation | Yield (kWh/kWp) | % of Theoretical Max |
|---|---|---|---|---|
| A (Bristol, south) | 810W | 738 kWh | 911 | 85% |
| B (Manchester, west wall) | 400W | 218 kWh | 545 | 55% |
| C (Cambridge, SE shed) | 820W | 642 kWh | 783 | 78% |
| D (Edinburgh, south) | 420W | 316 kWh | 752 | 80% |
| E (London, SW balcony) | 800W | 584 kWh | 730 | 75% |
Key observations:
Setup A (Bristol, south-facing, ground frame at optimal tilt) performed best — 85% of theoretical maximum. This matches what you'd expect from a well-positioned installation, even compared to professional roof systems.
Setup B (Manchester, vertical west-facing wall) performed worst — 55% of theoretical. The combination of west orientation (losing morning sun) and vertical mounting (suboptimal angle) significantly reduced output. This is still 218 kWh — worth about £57/year — but the payback stretches to 6–7 years on a single-panel setup.
Monthly Generation Breakdown
Setup A (Bristol, 810W, south-facing) — monthly kWh:
| Month | Generation | Daily Average |
|---|---|---|
| January | 18 kWh | 0.6 kWh |
| February | 28 kWh | 1.0 kWh |
| March | 55 kWh | 1.8 kWh |
| April | 82 kWh | 2.7 kWh |
| May | 102 kWh | 3.3 kWh |
| June | 108 kWh | 3.6 kWh |
| July | 105 kWh | 3.4 kWh |
| August | 91 kWh | 2.9 kWh |
| September | 68 kWh | 2.3 kWh |
| October | 42 kWh | 1.4 kWh |
| November | 22 kWh | 0.7 kWh |
| December | 17 kWh | 0.5 kWh |
The seasonal swing is dramatic: June generates 6 times more than December. This is typical for all UK solar, not specific to plug-in systems.
Self-Consumption Analysis
Since plug-in systems can't claim SEG payments (no MCS certification), self-consumption is everything. Any exported electricity is free to the grid.
| Setup | Self-Consumption Rate | Electricity Saved | Value (at 26p/kWh) |
|---|---|---|---|
| A (WFH household) | 82% | 605 kWh | £157 |
| B (Flat, one person) | 91% | 198 kWh | £51 |
| C (Family, partial WFH) | 74% | 475 kWh | £124 |
| D (Retired couple) | 88% | 278 kWh | £72 |
| E (Couple, WFH) | 78% | 456 kWh | £119 |
Self-consumption rates are high — 74–91%. This is because plug-in systems are small enough that most generation is absorbed by the household's base load (fridge, router, standby devices, working-from-home equipment).
Small Systems Have High Self-Consumption
Paradoxically, smaller solar systems often have better financial efficiency per kWh than larger ones. A 800W plug-in system with 80% self-consumption earns 26p for most of its output. A 4kW roof system with 40% self-consumption earns 26p for less than half its output and only 12p for the exported rest. Size isn't everything.
Financial Returns
| Setup | Total Cost | Annual Saving | Payback Period |
|---|---|---|---|
| A | £650 | £157 | 4.1 years |
| B | £380 | £51 | 7.5 years |
| C | £700 | £124 | 5.6 years |
| D | £420 | £72 | 5.8 years |
| E | £680 | £119 | 5.7 years |
Setups A, C, D, and E all achieve payback under 6 years — competitive with professional roof installations. Setup B's payback is longer due to the suboptimal west-facing vertical position.


EcoFlow Delta Pro 3.6kWh Portable Power Station
£1,5003.6
3.4
LFP
3500
Affiliate link — we may earn a small commission at no extra cost to you
What We Learned
1. Orientation Matters More Than You'd Think
The difference between south-facing at 30° (Setup A: 911 kWh/kWp) and west-facing vertical (Setup B: 545 kWh/kWp) is 40%. If you have a choice of where to put your panels, south-facing wins convincingly.
2. Tilt Angle Matters
Vertical panels (wall-mounted) generate roughly 25–35% less than optimally tilted panels (30–35°). If you can angle your panels even slightly, do it.
3. Microinverter Efficiency Is Good
The Hoymiles microinverters across all setups showed 95–97% conversion efficiency. No significant losses from the inverter.
4. Shading Is the Enemy
Setup C initially had 15% higher output before a neighbour's tree grew and introduced afternoon shading from May onwards. The June-August output dropped noticeably in year 2. Even partial shading on a single panel significantly reduces output.
5. Cleaning Made Minimal Difference
Panel cleaning was tested on Setup A — cleaning in August after 6 months of no cleaning improved output by approximately 2%. Not worth the effort for these small setups unless panels are under trees or near a busy road.
6. Winter Output Is Minimal But Real
Even in December, every setup generated something. Setup A produced 17 kWh in December — enough to offset the fridge's monthly consumption. It's not much, but it's not zero.
Don't Believe Inflated Claims
Some plug-in solar vendors quote generation figures based on southern European conditions or optimal lab measurements. Real UK generation is 20–45% lower than these claims, depending on your location and setup. Use the figures in this article — based on real UK data — for your planning.
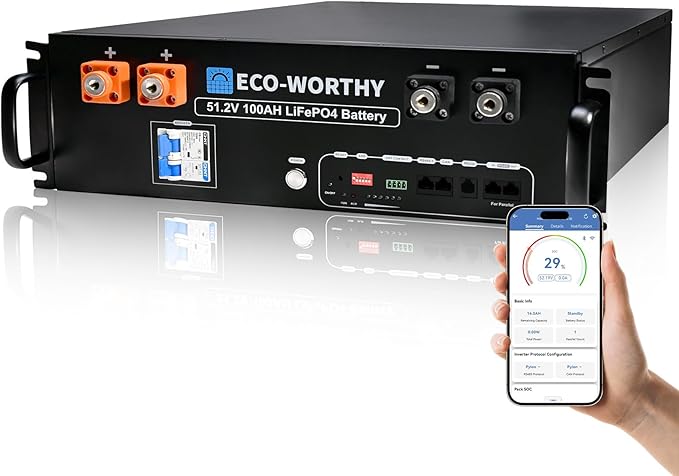
ECO-WORTHY 5.12kWh LiFePO4 Battery Module
£7005.12
4.9
LFP
4000
Affiliate link — we may earn a small commission at no extra cost to you
Recommendations Based on Our Results
Best Setup for Most People
Two panels (800W total), south-facing, ground-mounted at 30° tilt, with a Hoymiles HMS-800 microinverter. Expected generation: 600–750 kWh/year. Cost: £550–£700. Payback: 4–5 years.
Best Setup for Balconies
Two panels on a south-facing balcony railing. Expected: 450–600 kWh/year. Less optimal angle but still worthwhile.
Skip Unless You Have No Alternative
Single panel on a north-facing or heavily shaded wall. Generation drops below 200 kWh/year, extending payback beyond 8 years.
How These Compare to Full Roof Systems
| Metric | Plug-In (800W) | Roof System (4kW) |
|---|---|---|
| Annual generation | 600–750 kWh | 3,400–3,800 kWh |
| Annual saving | £120–£160 | £600–£900 |
| Cost | £550–£700 | £6,000–£8,000 |
| Payback | 4–5 years | 7–11 years |
| kWh per £ invested | ~1.0 kWh/£/year | ~0.5 kWh/£/year |
Plug-in solar delivers more generation per pound invested because of higher self-consumption rates and lower installation costs. But in absolute terms, a roof system generates far more and saves far more. They serve different needs and budgets.
For full details on setting up a plug-in system, see our plug-in solar guide.
Share this article
OVO has carefully selected trusted teams across the UK to install solar panels and heat pumps. Enjoy the personal touch of a local expert with the peace of mind of a household name.
Affiliate link — we may earn a small commission at no extra cost to you
Stay informed
Get free solar updates direct to your inbox
Related reading
Plug-In Solar Panels: Grid-Tied Without an Installer?
Plug-in solar panels in the UK: can you really plug solar into a socket? What's legal, what works, and what the regulations actually say about DIY grid-tied solar.
Balcony Solar Panels UK: A Practical Guide
Balcony solar panels for UK flats and apartments. What's possible, what's legal, how much they generate, and whether they're worth the investment in 2026.
Portable Solar Panels: Camping, Caravans, and Off-Grid
Portable solar panels for camping, caravans, motorhomes, and off-grid use in the UK. What to buy, how much power you'll get, and realistic expectations.

Switch to Octopus Energy
Get 50 credit when you switch. We get 50 too — win-win.
What does this mean for YOUR home?
Design your perfect solar setup in under 3 minutes. Free, no sign-up required.
Build Your Solar System